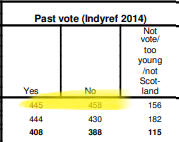
With the latest IPSOS poll there has been a lot of talk about the correct weighting for the 2014 referendum in such polls.
There are many ways to weight a poll and the 2014 recall may well not be reliable, which is why some pollsters don't bother with it anymore. However it's always interesting to see how those that do (even if it is a minor factor) use it approach the issue.
Ipsos reweighted the raw support in favour of No (458 to 455) towards Yes (444 to 430). They will have their reasons for this, and it may be that their weighting algorithm gives so little weight (maybe none)to this that it's almost irrelevant. However it does beg a few questions.

Assuming that the recall is correct, a big if. then the sample is effectively weighted to 2014 voters as 51% Yes and 49% No. So it would be kind of remarkable if this sample did not produce a majority for Yes seeing as it was weighted to 2014 voters. Another way to look at this is that the results are weighted 41% Yes, 42% No and 17% did not, could not vote,
But they're aw deed!
Now it seems some are arguing that this is perfectly fair, because since 2014 Scotland has experienced a large number of deaths, the recall 2014 vote must skew towards Yes and increase. This is just plain old rubbish.
That view entirely misses the subtle maths of what is going on here. Therefore I thought it would be worth showing in a little detail how demographics should affect these weighting.
Let's start at the beginning and the 2014 result.
Now of those voters some have died, infact using the NRS database we can see that 514876 people in Scotland have died since the referendum.
The naive thing to do is to lop them off No voters, i.e. 'old people vote no and old people die' and come up with a reweighting for that 2014 recall.
The trouble is that's just plain old wrong.
Sadly of those people that died not all of them were old, not all of them voted and not all of them were No voters.
So our reexamination of the correct weighting for 2014 needs to allow for all of this.
The NRS data gives us death by age, we can also use the 2014 Ashcroft post indyref poll to establish age related voting and allow for the fact that only 85% of this cohort would have voted.
Doing so gives us much more nuanced picture.
In the small early age deaths, the skew would be to Yes voters, but as the age of the death increases we get a greater skew to No voters dying.
The net effect of all of this is that 130K Yes voters have died and 301K No voters have died (the rest did not vote at all).
So how should this affect the 2014 recall weightings.
This is a skew of 47% yes and 53% no with a lot of voters now in the did not or could not vote bracket.
This is in my view the correct weighting for the 2014 recall, if you put any weight on it at all. Therefore polling weighing with Yes as a majority from 2014 should in all probability skew towards Yes right now.
I want more!
Now I can almost hear people looking for me to take the model a little bit further, i.e. what about all the new voters than have been added to the electorate since 2014.
The naive view would be that all these young voters are all Yes so we can replace all of those deaths with 100% Yes voters.
But it doesn't work that way either.
They also don't all vote, they don't all vote yes and more importantly it's making the flawed assumption that everyone else is voting the same way as 2014. This model is about predicting the correct allocation for the 2014 recall, it's not about predicting an indyref based on demographics.
The IPSOS poll alone shows that about 10% of Yes and No voters have since changed their minds in 2010. There is also no evidence that people will or will not change their independence preferences with age, for example are the 55 year old Yes voters of 2014, who are now approaching their retirement, all still voting No or are they adopting the more pro-No attitudes of the 64 years old of 2014.
Indeed the current 65+ polling from YouGov shows that since 2018 the Yes no split is flat and rising and falling broadly in line with the national mood. There is no evidence of an age decay in this cohort as it's apparently getting 'infected' with younger Yes voters entering this age group.
Ashcoft's 2014 independence results poll shows that 73% of 65+ voted Yes (the current level the poly trend is currently at). So in 10 years there has been zero change in the 65+ cohort. According to the inevitable demographics theory this is impossible.
So what we do know is that polling predictions based on inevitable demographics are just flawed. They operate on the fallacy of Static Demographic preferences, when in practice attitudes do change with age. I debunked all of this a very long time ago, if this theory was correct Yes would have won in 2014, It's also worth pointing out that polling from the 1970s to 2010 with a consistently strong bias towards the Conservatives from older aged voters means that from 2010 it was all but inevitable that there would be a permanent Labour Government from then until now, if the Static Demographic preferences hypothesis was correct.
The reality was very different.
So rather than take this to a flawed of prediction I will just end here.
The 2014 skew should be 35% Yes, 40% No and 25% Didnt.


Comments
Post a Comment